
Bitcoin Price Analysis
Bitcoin price analysis shows that the present bullish momentum has yielded good results as BTC is now trading at $23,039 at the time of writing, as today is the highest range for the past 24 hours. Since the recovery from $22,688 to its current price level, BTC has seen a 2.05% increase in value. Despite the downtrend from yesterday, the bulls have been able to gain back the lost ground and have pushed BTC/USD above the $23,000 level.

Bitcoin’s technical analysis indicates BTC is trading well above the 100-day EMA, which is a reversal pattern. Additionally, the 50-day EMA is trending above its 100-day counterpart for the last 24 hours. The RSI is at 84.47, indicating the bullish momentum will continue in the short term. The MACD shows that the price is in the bullish zone, and the histogram is rising, which suggests that the uptrend of BTC/USD will continue for some more time. The 50-SMA and 200-SMA lines have been trending higher, indicating a strong bullish trend in the market.
Ethereum Price Analysis
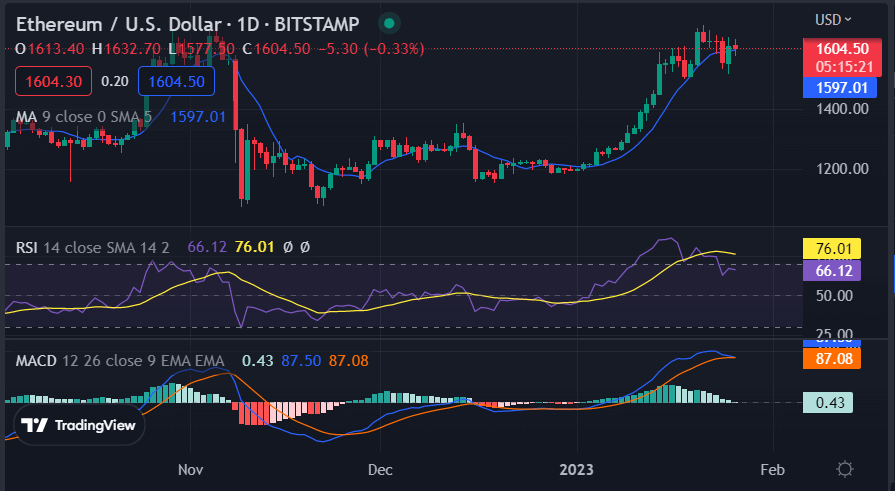
Ethereum price analysis gives an optimistic indication for cryptocurrency buyers as the price increases during the day. The bulls have managed to control the price movement for today, and the market analysts have observed a tremendous rise in ETH/USD value. The bulls have managed to trade above the support level of $1,554 and are now eyeing the next resistance level at $1,632.

The moving averages have also provided support for the bullishness as the 50-day moving average (MA) and the 200-day MA have crossed over, which is a sign of price strength.
The present surge in demand for ETH coins has caused a price spike, as indicated by the Relative Strength Index (RSI) which noted it had hit an overbought. This is often indicative of a trend reversal that could result in market stabilization. The Moving average coverage divergence (MACD) also showed a bullish momentum in the price movements as the MACD line crossed over the signal line.
Litecoin Price Analysis
Litecoin price analysis shows a strong bullish trend for the cryptocurrency as it has made further gains in the past 24 hours. Currently, the LTC/USD has gained more than 1.02% in the past 24 hours and is trading at $88.05 making highs of $92.00 during the day. The trading volume is also high with over $594 million being exchanged as the bulls continue to take control of the market, while the market cap stands at $6.34 billion.

The moving average (MA) is also trading on an upwards line and is present at $87.48 above the SMA 50 curve. The volatility is increasing with Bollinger bands expanding, thus indicating a strong bullish trend for Litecoin. The upper Bollinger Band is present at $92.81, while the lower Bollinger band is at $78.12, indicating further upside in the prices of Litecoin. The Relative Strength Index (RSI) score has also been increasing for the past few hours, and the indicator has reached index 66.86; the upwards curve of the indicator hints at the buying activity of the LTC assets.
Cardano Price Analysis
Cardano (ADA) is one of the biggest gainers today, rocketing by 6.62%.

The price of Cardano (ADA) is trading near the resistance level at $0.3832, after the fasel breakout of the support at $0.3736. If buyers can hold the gained initiative by the end of the day, the further rise may continue to the $0.39 mark tomorrow.


